
In Summary
- AFCON 2025 will be shaped by key statistics including rankings, goals per game, defensive records, set-piece efficiency and squad depth.
- Home advantage, goalkeeper performance, injury impact and squad rotation are likely to play decisive roles in tight matches.
- Historical trends and qualification momentum offer strong indicators of which teams may progress deep into the tournament.
Deep Dive!!
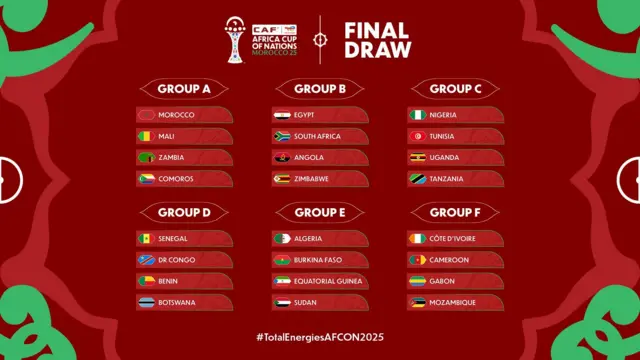
Saturday, 20 December 2025– As the Africa Cup of Nations (AFCON) 2025 approaches kick-off in Morocco (21 December 2025 to 18 January 2026), several statistical trends and performance indicators are poised to shape outcomes, narratives and surprises throughout the tournament. Beyond goals and results, deeper numbers help frame expectations, guide tactical analyses and focus fan attention on the elements most likely to influence success or disappointment.
These key stats reflect both team and individual-level dynamics that matter on the pitch, offering insight into which nations hold structural advantages, which players might emerge as difference-makers, and where historic patterns could repeat or be disrupted.
FIFA Rankings and Recent Form: A Top-Tier Snapshot
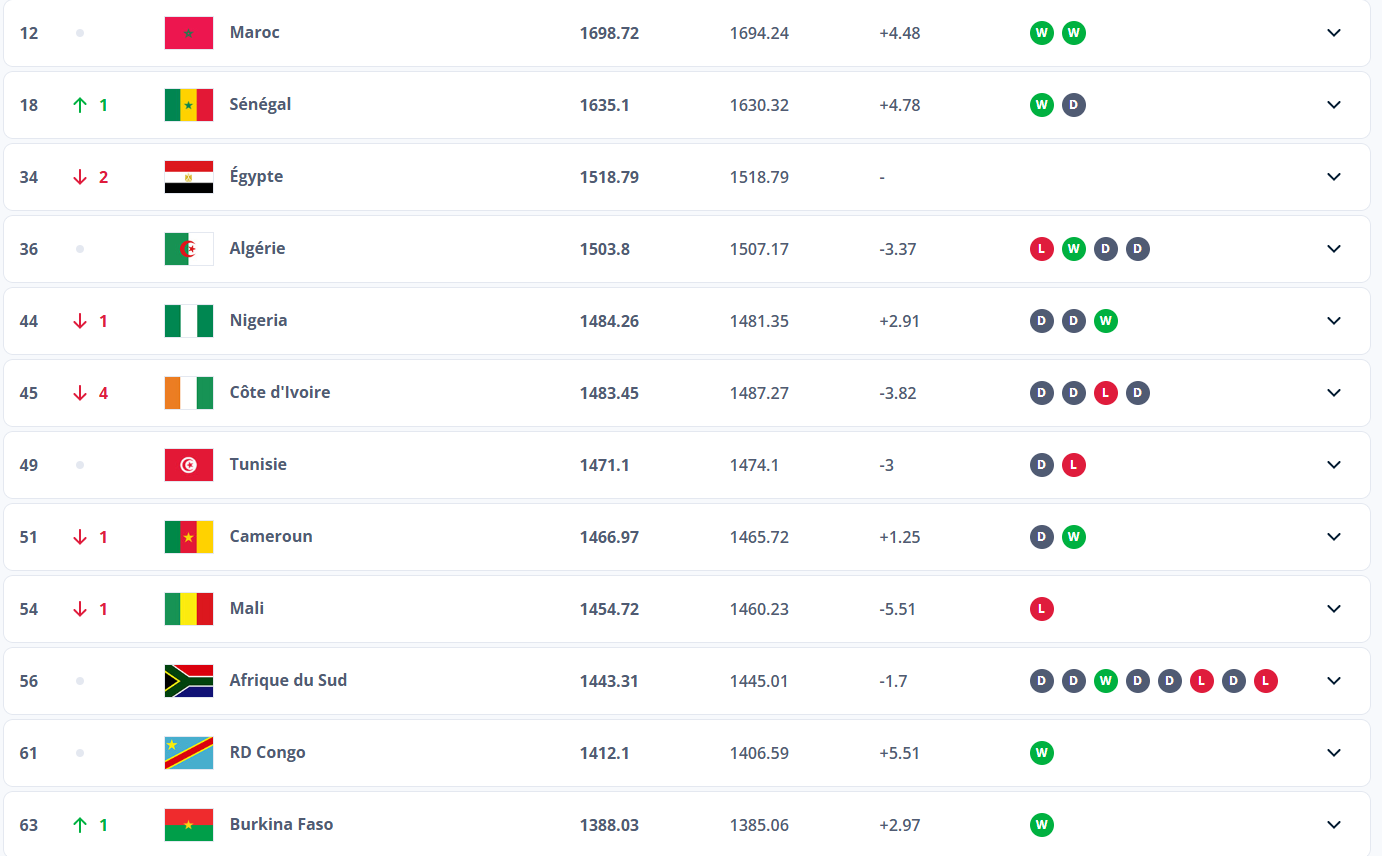
One of the most closely watched statistical indicators ahead of AFCON 2025 is the FIFA World Ranking positions of participating teams. Higher rankings often correlate with deeper squads, greater international experience and sustained competitive results. As of late 2025, traditional powerhouses such as Morocco, Senegal, Nigeria and Egypt sit near or within Africa’s top 15 in global rankings, reflecting consistent performance in qualifiers, friendlies and continental competitions. These positions suggest underlying stability and squad quality that often translates into tournament success.
In contrast, nations outside the top ranking bracket (even those with passionate fanbases and storied footballing histories) face statistical uphill battles. Lower ranked teams historically experience fewer deep runs, with knockout progression often hinging on discipline, tactical discipline and occasional star performances rather than structural depth. At AFCON 2025, these ranking disparities provide a statistical backdrop for favorite designation and upset potential alike.

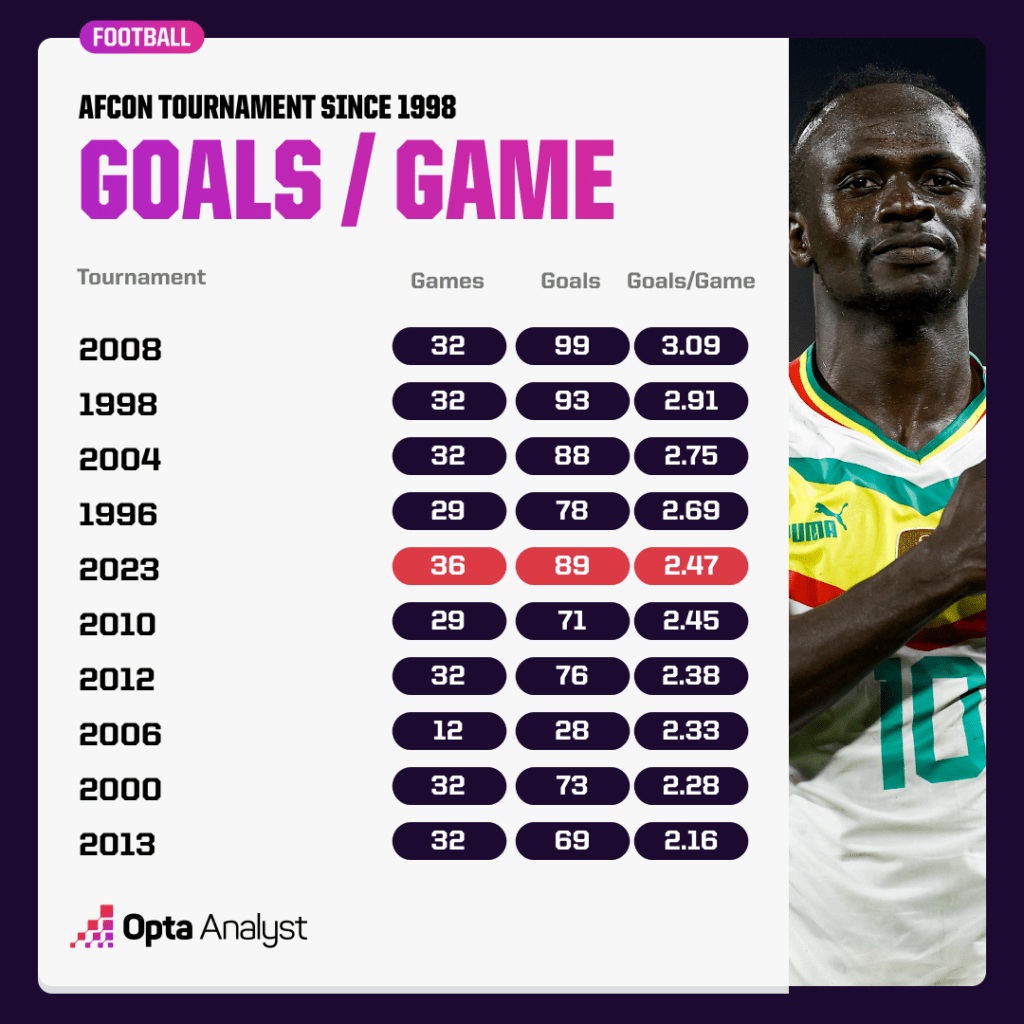
Goals per Game Equals Attack Versus Defense Balance
A defining stat in any AFCON is the goals-per-game average, both at the team and tournament level. In recent editions, average goals have hovered around 2.3 to 2.7 per match, a number that indicates open play and tactical fluidity in African football. Teams such as Senegal and Nigeria have ranked among the highest in goals scored during qualifiers, with lethal attacking duos and swift transitions yielding high expected goals (xG) figures. Those offensive outputs place them statistically near the top of anticipated scoring charts.
Conversely, defensive solidity has historically delivered AFCON success. Morocco’s home defensive record and low goals conceded per match in recent competitive fixtures signal a team built on control and structure. Statistical trends over the past decade show that teams conceding fewer than 1 goal per match in group play have better odds of advancing past the quarter-final stage. For AFCON 2025 analysts, the interplay between attack potency and defensive resilience remains a key statistical story.
Set Pieces and Conversion Rates
Set pieces (free kicks, corners and penalties) often decide tight AFCON matches. Across AFCON qualifiers and warm-ups leading into 2025, nearly 30% of goals in competitive fixtures stemmed from set-piece scenarios, a figure reflected in global datasets tracking African team performance. Teams with higher set-piece conversion rates, including Egypt and South Africa, recorded some of the best expected goal (xG) figures from indirect play, indicating tactical maturity and preparation.
Penalties remain a distinct statistical realm. Average penalty conversion rates at major international tournaments hover near 75–80%, but in AFCON history, teams with reliable spot-kick takers win crucial knockout ties. Statistically, a squad with multiple high-conversion penalty takers significantly improves its odds in group margins and tightly contested knockout fixtures.

Experience Versus Youth Reveals Squad Age and Caps
Squad composition trends are emerging as a key stat heading into AFCON 2025. Teams with higher average caps per player tend to manage high-pressure games more effectively. For example, Egypt and Algeria have squads with multiple players exceeding 50 senior caps, signifying seasoned leadership on the field. Historically, such experience correlates with deeper tournament runs, particularly in knockout scenarios where game management becomes crucial.
In contrast, other squads are leaning younger. Teams like Comoros and Tanzania boast rising talents with fewer caps but high athleticism and upside. Statistical models indicate that younger teams can outperform expectations when supported by tactical cohesion and minimal injuries. AFCON 2025’s statistical narrative thus includes a balance of experience metrics and youth indicators, highlighting how differing squad profiles might yield unexpected results.
Home Advantage and Stadium Data
One of AFCON 2025’s most compelling statistical stories is host nation advantage. Morocco’s national team has posted impressive home records in CAF competitions and friendlies, including winning percentages above 70% over the past two years, a figure far above continental norms. Historical AFCON host statistics show that host squads have a significantly higher probability of reaching at least the semi-finals, driven by strategic familiarity, fan support and logistical ease.
The distribution of venues (nine stadiums across six cities) highlights another statistical nuance: travel distance impacts team performance. Data from recent AFCONs suggest that teams facing back-to-back long transit schedules win fewer points compared to those with consolidated group venue assignments. Morocco’s compact venue layout, combined with passionate crowd support, offers a tangible statistical edge for home side performance and possibly, knockout progression.
Goalkeeper Metrics: Saves, Clean Sheets and Expected Goals Against
Goalkeepers directly influence tournament narratives via clean sheet rates, save percentage, and expected goals against (xGA). Senegal’s keeper, for instance, registered a top-tier save percentage and multiple clean sheets in qualifiers, statistics strongly associated with teams advancing deep into tournaments. In AFCON history, teams with two or more clean sheets in group play statistically increase their quarter-final and semi-final probabilities.
With several goalkeepers abroad in Europe’s top leagues, their club performance data becomes a predictive input. Players with high club xGA differentials (preventing more goals than expected) often carry that form into international stages, indicating that goalkeeper metrics will play a significant statistical role in forecasting match outcomes, particularly in tight knockout ties.
Substitutions, Minutes Played and Squad Rotation
Modern football analytics track not just who starts matches but how many minutes key players accumulate and how substitutions correlate with results. Across CAF qualifiers and club football leading into 2025, teams that optimized substitution patterns (introducing fresh attackers after the 65th minute) saw increased goal probabilities and higher points totals. These rotation metrics provide insight into depth and tactical flexibility.
Teams with balanced rotation (leveraging impactful substitutes without disrupting core performance) statistically achieve higher points per game in congested schedules. AFCON’s compact timetable magnifies this dynamic: squads that manage player minutes effectively lessen fatigue and exposure to injury risks, improving their statistical likelihood of success across six potential matches.
Historical Deep Runs and Knockout Data
Historical performance in AFCON provides statistical context for expectation management. Teams with records of reaching at least the quarter-finals in the past five editions, such as Côte d’Ivoire, Senegal, Ghana and Egypt, maintain top-tier knockout progression percentages. Such historical patterns, when combined with current squad metrics, inform statistical forecasting models and betting markets.
Conversely, nations without deep historical runs but with recent improvements in qualifying performance, like Uganda and Benin, present statistical anomalies worth watching. These outliers challenge traditional models and remind analysts that football has variables (such as form, draw difficulty and tactical matchups) that defy simple historical repetition.
Injury Impact Metrics and Absentee Forecasts
Injury data matters statistically. Absences of key scorers, midfield architects, or defensive leaders typically reduce a team’s goal probability and increase defensive risk. AFCON 2025 has already seen several notable absences due to injury or selection decisions; statistical models use player minutes, goal contributions and defensive clearances lost to quantify impact on match predictions.
For example, losing a forward with a high expected goals (xG) tally can lower a team’s projected goals per game by nearly 0.4–0.6 goals, a significant margin in tight group fixtures. Teams that adapt well toward balanced contribution from multiple scorers reduce statistical vulnerability, which can be decisive in tiebreaker scenarios under tournament rules.
Qualification Records and Momentum Scores
Finally, the momentum teams carry into AFCON, measured through qualification points, goal differential and win streaks, often predicts early group stage success. Teams finishing qualification with positive differentials (such as +5 or more) outperform those with neutral or negative differentials, statistically correlating with round of 16 progression and beyond.
Similarly, some teams enter the tournament on sustained unbeaten runs in competitive matches. Combined with momentum scores that adjust for opponent strength, these statistics offer predictive insight into which squads might reach the latter stages, emphasizing AFCON’s blend of form and historical influence.
AFCON 2025 will be defined not just by goals and celebrations, but by the statistical patterns underpinning performance: ranking, scoring balance, set-piece efficacy, squad depth, momentum and venue advantages. By examining key data points, fans, analysts and coaches gain richer understanding of what might unfold in Morocco, blending tradition, talent and numbers in Africa’s greatest football festival.
We value your thoughts. If you have comments or feedback about this article, reach out to our Editor-in-Chief at editor@dissimilarmedia.com.
Related News
$1.2 Billion, 9 World Cup Spots, and a 2030 Host: Infantino's African Legacy Ranked
Mar 01, 2026
CAF Issues Heavy Sanctions After AFCON 2025 Final Chaos: Senegal and Morocco Punished
Jan 29, 2026
Top 10 Greatest AFCON Victory Parades of All Time
Jan 22, 2026